Using Digital Topo Maps to Identify Natural Firebreaks in Wildfire Zones
You can spot natural firebreaks on digital topo maps by looking for rivers, rock outcrops, and ridgelines that disrupt fuel continuity. Wide rivers and steep, rocky terrain slow fire spread, while tight contour lines reveal slopes that may stall flames. Check for sparse vegetation in low-fuel zones, and overlay real-time weather and fuel moisture data to assess effectiveness. Tools like QGIS or ArcGIS help, but need reliable data and practice. See how terrain and conditions combine to shape fire behavior.
Notable Insights
- Rivers and streams appear on topographic maps as blue lines, with wider waterways offering more reliable natural firebreaks.
- Rock outcrops and scree fields show up as irregular, contour-free areas or abrupt elevation changes, indicating low-fuel zones.
- Closely spaced contour lines reveal steep slopes that may slow fire spread by forcing flames uphill.
- Drainage patterns and low-lying areas often indicate moist, less flammable zones that can act as firebreaks.
- Sparse vegetation on ridgelines or in shaded valleys can be inferred from contour spacing and aspect analysis on digital topo maps.
What Are Natural Firebreaks?
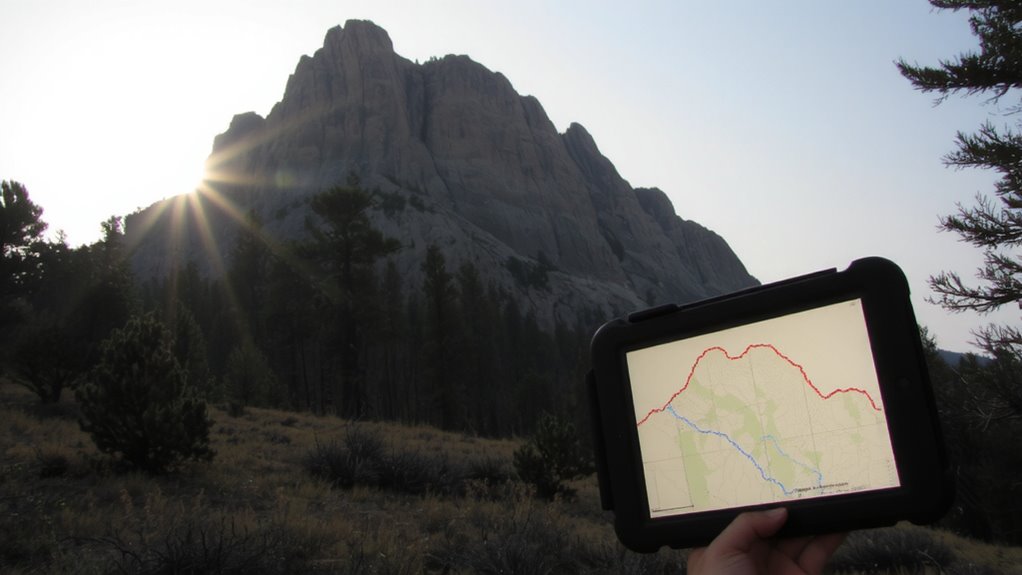
A natural firebreak is a feature in the landscape that slows or stops the spread of wildfire, and you’ll find these on digital topo maps once you know what to look for. Rivers, rock outcrops, and roads often serve as physical barriers. So do areas with sparse or low-fuel vegetation. These breaks form through ecological succession, where plant communities shift over time to species that are less flammable or more widely spaced. You can spot them by color and contour patterns indicating changes in ground cover. Effective vegetation management, like mowing or controlled burns, maintains these zones. Without upkeep, regrowth increases fire risk. Natural firebreaks aren’t foolproof-they depend on weather, fuel load, and fire intensity. But when combined with mapped terrain data, they improve odds. You’re better off identifying them before fire season, not during. Use topo maps to plan routes and safe zones based on verified features. For optimal preparedness, consider using best survival maps that integrate detailed topography with fire history layers.
How Topo Maps Reveal Fire-Slowing Terrain
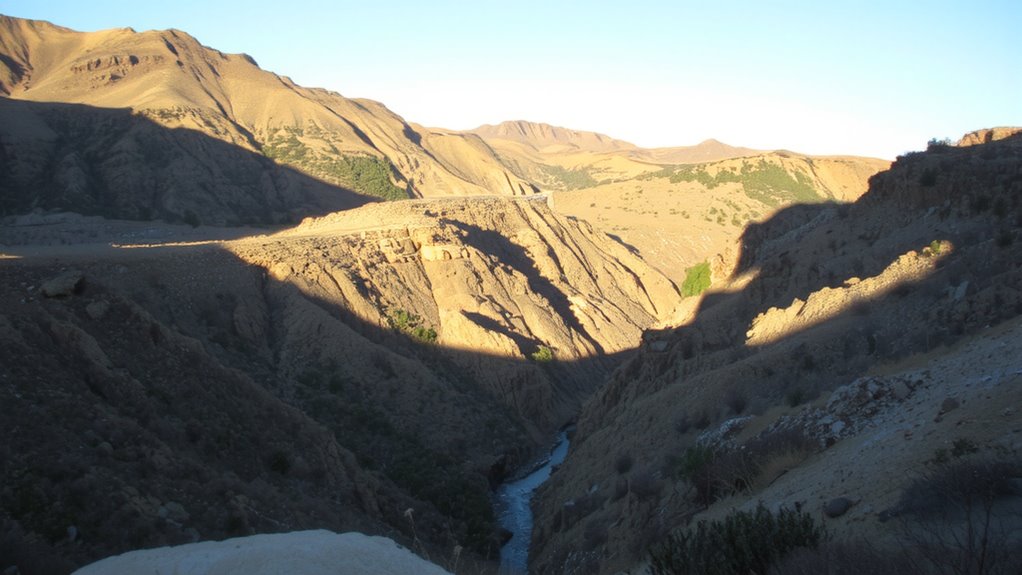
Though terrain alone won’t stop every fire, you can use digital topo maps to identify features that slow fire spread by analyzing elevation, slope, and land cover. Steeper slopes often accelerate fires uphill, but you’ll notice fire slows on gentler terrain or where elevation changes disrupt airflow. Drainage patterns show natural corridors where moisture collects, creating cooler, less flammable zones. Look for dips and valleys-they often support higher vegetation density, but if those areas are shaded or moist, they burn slower. Conversely, sparse vegetation density on ridgelines dries fast and ignites easily, while dense, shaded forests in low-lying areas may resist ignition due to humidity. You can cross-reference topo contours with satellite imagery to confirm these patterns. It’s not about finding walls-it’s about spotting subtle shifts in the land that reduce fire intensity. Use these clues to anticipate where flames might weaken, giving you tactical advantages in planning and escape.
Map Rivers, Ridges, and Rock Outcrops as Firebreaks
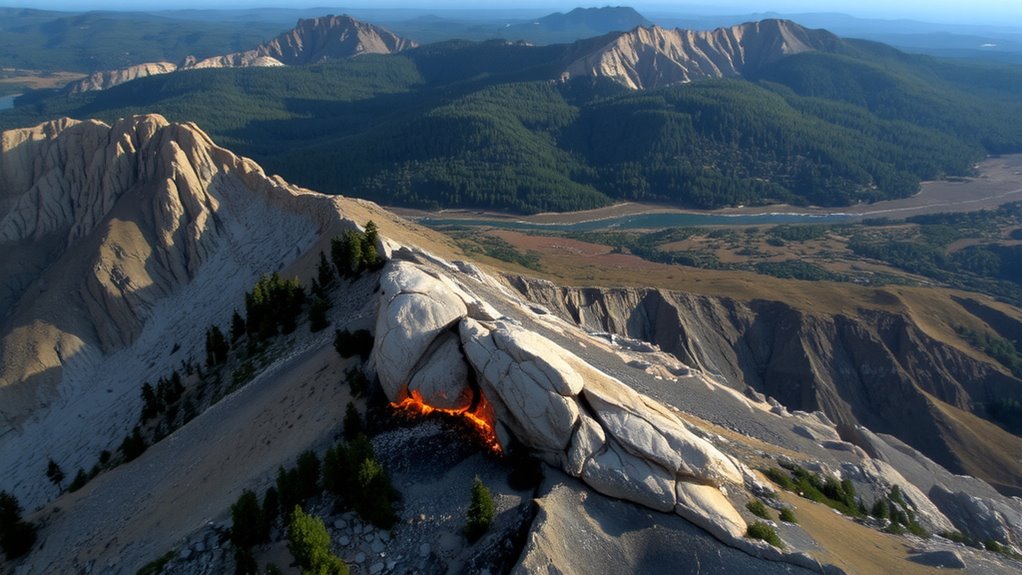
Because rivers, ridges, and rock outcrops don’t carry fuel, they can act as effective natural firebreaks, and you can spot them easily on digital topo maps. You’ll use river mapping to track waterways that block fire spread-the wider the stream, the more reliable the barrier, especially in dry seasons when smaller channels may not hold water. Ridges force flames to travel upward, slowing their advance; contour lines spaced far apart indicate gentler slopes where fire creeps faster, while tight lines show steep terrain that can stall a fire. Rock identification helps you mark exposed outcrops and scree fields-areas with little vegetation. On topo maps, these appear as irregular, contour-free zones or sudden elevation shifts. Light-colored symbols often denote bare rock. You can rely on these features when planning escape routes or suppression zones, but verify ground truth since some streams dry up and not all rocks are visible at map scale.
Layer Fire and Weather Data on Topo Maps
You’ve already mapped rivers, ridges, and rock outcrops to find natural firebreaks, but knowing where fire might stop isn’t enough if you can’t predict where it’s headed. By layering fire and weather data onto your topo map, you gain real-time insight into fire behavior. Current wind direction, temperature, and humidity levels directly influence how quickly and in which direction flames spread. Fuel moisture levels-measured as a percentage-are critical; values below 10% mean vegetation ignites easily, increasing fire intensity. When you overlay recent satellite-derived fuel moisture maps with topographic features, you see where dry fuels meet terrain that could accelerate fire spread. This combo lets you anticipate shifts in fire behavior even before flames reach a ridge or river. You’re not just identifying barriers-you’re modeling likely paths. Combining these layers increases accuracy without relying on guesswork.
Best Tools for Real-Time Firebreak Analysis
When it comes to real-time firebreak analysis, your best move is using GIS platforms like ArcGIS FireView or QGIS with live data plugins, since they let you overlay current fire perimeters, weather forecasts, and fuel moisture levels directly onto topographic maps. These tools integrate satellite imagery and support fire modeling to predict spread paths and identify effective natural firebreaks quickly. Real-time updates help you adjust as conditions shift, which is critical during active incidents.
| Tool | Best For |
|---|---|
| ArcGIS FireView | Operational fire modeling with official data feeds |
| QGIS + FIRMS plugin | Fast access to satellite imagery and thermal alerts |
| Google Earth Engine | Custom firebreak analysis using historical and live data |
You’ll want reliable connectivity and some training, but the accuracy and speed are worth it. Choose based on your data needs and response timeline.
On a final note
You’ll rely on digital topo maps because they show terrain features that slow fires-ridges, rivers, rock-without guesswork. Layering current fire and weather data improves accuracy, but signal loss or outdated maps reduce reliability. Tools like CalTopo or Gaia GPS offer real-time analysis, though offline access is essential. Trade-offs exist: detail versus battery life, accuracy versus speed. You’ll get the best results combining map analysis with on-ground observation-maps guide, but don’t replace, judgment.