Using Digital Elevation Models to Identify Thermal Air Currents for Shelter
You can spot where warm air rises and cold air sinks by analyzing terrain with digital elevation models. South-facing slopes heat up and radiate warmth, while valley bottoms trap cold air at night. Steep gradients show strong airflow; depressions indicate frost risk. Use free tools like Google Earth Pro and QGIS with SRTڅM data to map solar exposure and drainage patterns. Place shelter mid-slope, just above drainages, to stay above cold pools-optimal positioning saves you from freezing surprises.
Notable Insights
- Digital Elevation Models (DEMs) reveal airflow channels by mapping slope angles and elevation gradients critical for identifying thermal currents.
- Valley breezes and ridge lifts can be predicted using DEMs to locate sun-facing slopes and topographic barriers influencing air movement.
- Steep terrain in DEMs indicates strong updrafts or cold air drainage, helping avoid frost-prone shelter locations.
- DEM analysis identifies wind funneling in canyons and plateaus, guiding shelter placement for warmth and wind protection.
- Overlaying solar exposure and cold air pooling models from DEMs optimizes shelter positioning just above drainage zones.
How Warm and Cold Air Move Across Terrain
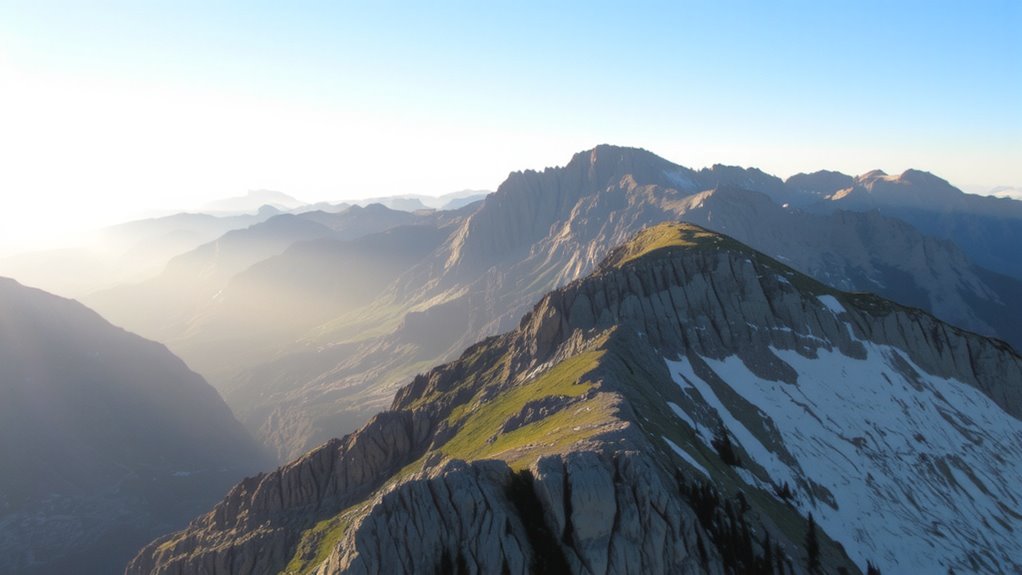
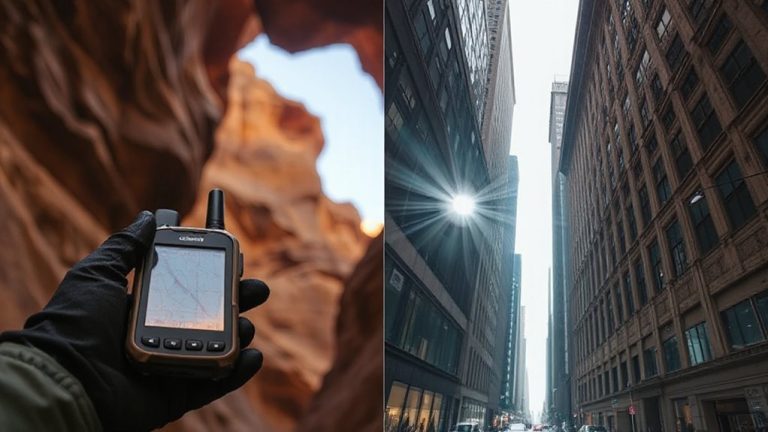
When warm air rises over uneven terrain, it follows the path of least resistance, and you can predict its movement by studying slope orientation and surface features. You’ll find valley breezes developing as heated air ascends slopes during the day, pulling air up from lower elevations. These currents are reliable in stable conditions and strongest on sun-facing slopes. At night, the reverse happens-cool air drains downhill, forming katabatic flows. Ridge lifts occur when wind meets a topographic barrier, forcing air upward along exposed edges. These lifts sustain stronger, more consistent currents than thermals over flat ground. Valley breezes and ridge lifts combine in complex terrain, creating overlapping airflow zones. You can use this behavior to locate natural ventilation paths or shelter positions. Avoid low spots at night-they collect cold, dense air. Elevated ridges offer better airflow but expose you to stronger winds. You don’t need instruments to spot these patterns-just observe wind indicators and terrain shape.
How DEMs Reveal Natural Airflow Patterns
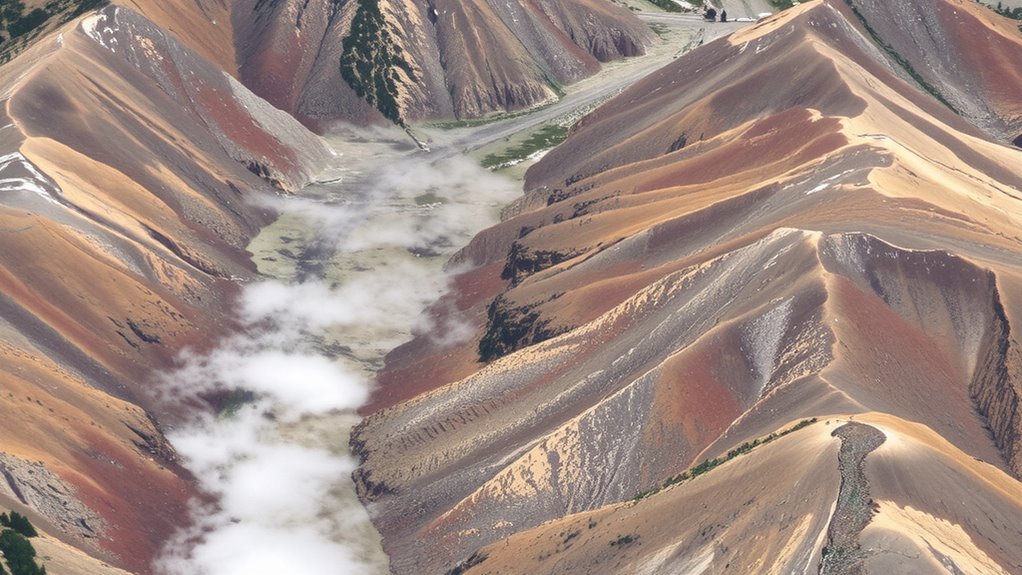
Because digital elevation models (DEMs) map terrain in fine detail, you can spot airflow patterns that aren’t obvious on the ground. You’ll see how wind patterns shift around ridges, valleys, and slopes, revealing where air accelerates or pools. Steeper elevation gradients show where cold air drains quickly at night or where updrafts form on windward faces. These models let you predict airflow behavior before you set up shelter. You don’t need field sensors-just the elevation data and an understanding of how air moves. In canyons, DEMs expose funneling effects that intensify wind. On plateaus, subtle gradients indicate diffuse flow. By analyzing contour lines and slope angles, you identify natural channels and barriers. It’s not guesswork; it’s using measurable terrain features. DEMs give you a clear view of how wind interacts with topography so you can choose safer, more efficient shelter positions based on actual airflow patterns.
Find Winter Warmth on Solar-Heated Slopes
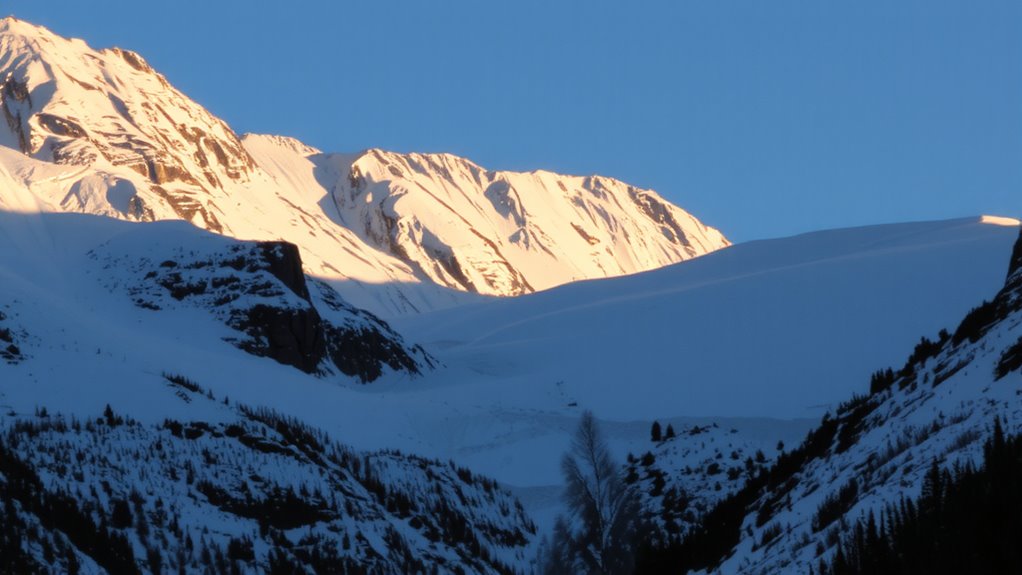
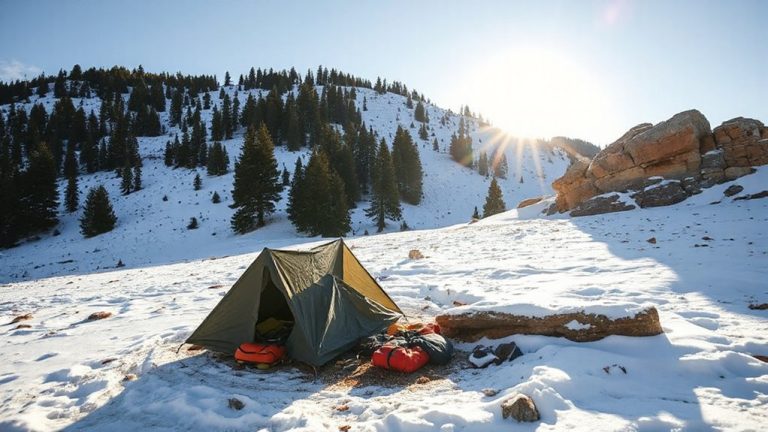
Where could you find a few extra degrees of warmth on a cold winter night? On south-facing slopes that receive consistent solar radiation during the day. These slopes absorb heat, which radiates slowly after sunset, raising ground-level temperatures slightly. You’ll benefit more in mid-latitudes where sun angles are low, maximizing exposure on inclined surfaces. Digital elevation models help you identify these slopes by showing aspect and gradient clearly. But don’t ignore wind exposure-open slopes might gain heat but lose it fast if strong winds strip away warmed air. Sheltered solar-exposed areas, like leeward sides of ridges, reduce wind exposure while maintaining heat gain. The trade-off? Too much shelter might block sunlight; too much openness increases convective cooling. Pick a mid-slope position with direct daytime sun and a natural windbreak uphill. It balances solar gain and wind protection, giving you measurable thermal advantages without relying on gear.
Avoid Cold Air Pools in Drainage Zones
South-facing slopes give you a thermal edge during winter, but that warmth means little if you’re sitting in a cold air trap. Cold air flows downhill and pools in drainage zones, creating frost hollows where temperatures can drop 5–10°C below nearby ridges. These hollows are especially dangerous at night when inversion layers form, trapping dense, cold air near the surface. You won’t stay warm no matter how good your gear is if you’re camped in one. Digital elevation models help spot these zones-look for dips, valley bottoms, or bowl-shaped depressions where cold air accumulates. Avoid them. Even a 20-meter climb upslope can keep you out of the coldest layer. Inversion layers make nighttime lows worse in low spots, so position your shelter on slightly elevated ground just above drainages. You’ll feel the difference at dawn.
Place Your Shelter Using Airflow Data
How often do you check the wind before pitching your tent? You should-airflow data helps you avoid wind convergence and air stagnation, both of which reduce shelter efficiency. Wind convergence occurs where opposing airflows meet, creating turbulence that increases heat loss and stress on your tent. Place your shelter outside these zones, typically found near ridgelines or opposed slopes, to maintain stability and warmth. Air stagnation, common in bowls or enclosed depressions, traps cold air and limits ventilation, raising condensation risk. Use digital elevation models to identify terrain channels and ridges that promote consistent airflow. Position your shelter slightly off ridge crests or in shallow slopes where moving air enhances convective heat retention. Avoid flat zones with no drainage or wind movement. Proper placement doesn’t require perfect conditions-just enough airflow to prevent cold pooling and maintain comfort. Your survival depends on such precise, repeatable choices.
Free Tools to Map Thermal Airflow
Ever wondered how to spot rising warm air or cold air drainage on a topo map? You can map thermal airflow using free digital tools that analyze elevation gradients and wind patterns. Google Earth Pro lets you view terrain in 3D, helping identify slopes where warm air rises by day and cold air sinks at night. Use the elevation profile tool to check gradients-steeper slopes often enhance airflow. NOAA’s HRRR model shows wind patterns hourly, overlaying data on terrain so you can correlate airflow with landscape features. QGIS, a free GIS platform, works with SRTM or LiDAR data to model solar radiation and cold air pooling. It’s precise but has a learning curve. These tools don’t replace field observation, but combined, they offer practical accuracy for site selection. You’ll see where thermals form and avoid poor shelter spots. Use them together for better predictions.
On a final note
You can use digital elevation models to find better shelter spots by tracking how air moves. Warm air rises, so south-facing slopes trap heat. Cold air sinks, pooling in valleys-avoid them. Tools like QGIS or USGS data show these patterns clearly. Position your shelter just above drainage zones for warmth and airflow. It’s not perfect, but it beats guessing. You trade some effort for smarter placement-worth it when temps drop.